Categories
A. Mattingly Diagram

Four Years of Billie Eilish

Click the image to see the enlarged infographic.

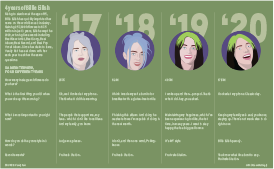
Billie Eilish, age 18, is one of the biggest and fastest-rising stars in the music industry today. After writing, producing, and releasing her first song, Ocean Eyes, at the age of 14, Eilish quickly rose to stardom and swept the 2020 Grammy’s, taking home 5 awards. Vanity Fair has interviewed Billie Eilish on the same day for four years in a row. As one of my favorite artists, I thought it would be interesting to illustrate Billie Eilish as she looked in each of the four interviews to show the change in her appearance over time, as well as her mindset as reflected in some of her answers.

In the past, I have been more focused on topics that deal with economic or social issues, but I decided to stray from that a bit with this project and focus in on something that I see as relevant to possible future careers. I’m super interested in music and pop culture, as well as vector art inspired by pop culture, so I decided to create a package that would be seen in a magazine, rather than a newspaper. While the style, in terms of color and layout, is much different than my other packages, I’m happy that I stepped out of my comfort zone and allowed myself to use colors other than black and white. I’ve mentioned color palettes as a big struggle for me in the other two projects, and I think the problem is that I was trying too hard to keep my style consistent with a newspaper piece, rather than letting my creativity take over. I did keep my typography consistent with my previous styles, apart from the large numbers displaying the years.

Overall, I am pretty happy with the layout, colors, and illustrations in this package. I was nervous that maybe it’s not explanatory enough to be considered a diagram, but I really wanted the focus to be on the change of Billie Eilish, in terms of looks and personality, throughout the past 4 years. Looking back, I probably should’ve incorporated some arrows to represent the idea of progression and made it more obvious the goal I had in mind. Similarly, after further inspection of my illustrations, there are some inconsistencies regarding the style of the four illustrations, and there are some tweaks I could make to ensure they all look cohesive.
Categories
A. Mattingly Map

COVID-19 College Enrollment

Click the image to see the enlarged graphic.

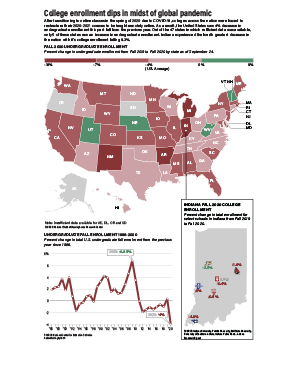
Following the transition from in-person to remote-online learning by colleges and universities across the nation, many predicted an overall decrease in enrollment. While these predictions were true in a majority of states, the drop was less drastic than expected.

The most difficult aspect of this project was gathering data. While I was able to find some recent, reliable data for the U.S. map, finding Fall 2020 enrollment numbers for the Indiana schools was especially challenging. I was unable to find numbers for all of the schools on my list, and I had difficultly making the decision of which schools to include in the first place. Apart from the data, I also am not very pleased with the Indiana map as a whole. I really wanted to incorporate the school logos as a visual component, but it feels to me as if the red is overwhelming, and the map as a whole feels like it’s missing something.

Once again, I struggled with the color palette within the package as a whole. Red and green felt like the best colors to use for differentiating between positive and negative numbers, but these colors inherently register as “Christmas” to me. The choice of red also posed issues within the Indiana map and the overwhelming presence of red within the logos. Overall, I do feel that the package conveys the information I was aiming for, and I do feel confident in the reliability of my data, but my overall styling could use some work for my taste.

Categories
A. Mattingly Chart

And the rich get richer

Adam Mattingly's Chart Project
Click the image to see the enlarged infographic.

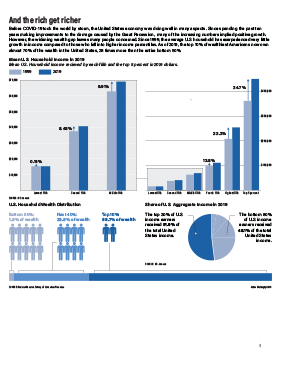
Income and wealth inequality is one of the biggest issues facing the United States today, and the issues is worsening, becoming more and more urgent. However, the raw numbers in dollars can be difficult for the human mind to comprehend, and many members of the population do not realize how drastic the wealth and income numbers are skewing in favor of a tiny, wealthy top percent of our country. Therefore, I felt these numbers would be represented by comparing percentages, making the information easier to comprehend.

I have included 2 bar graphs, one being a zoomed in version of a smaller portion of the other chart. I felt the lower half of the data needed to be zoomed in to place emphasis on the drastic differences in the increase in incomes between each fifth of the United States population. I also included a single bar broken up into 3 groups of Americans, based on how much wealth they have. I felt it was important to visually show a comparison of the amount of people in each group to show how imbalanced the numbers are, hence the use of the stick figures. My pie chart has a similar goal, portraying how a small percent of Americans make over half of the overall income earned in the entire country. I decided to show this data in just 2 groups, showing how one tiny percentage compares to the entire rest of the country.

The main aspect I struggled with in my package was choosing a color scheme. I was weary of using the same colors on each graph, as the graphs are divided into different percentages of people, but was having difficulty finding 6-7 different colors that fit well together without looking childish. Therefore, I decided to use the same colors to keep the package looking professional and cohesive.