
I really care about labor and workers’ rights and all that (my dad was a Teamster!) so I used the most recent set of data on union membership as released by the Bureau of Labor Statistics.
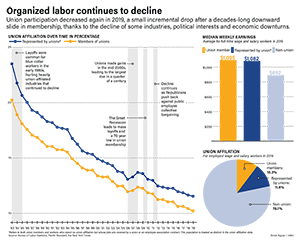
I was of course struck by the decline evident in the numbers available from 1983 onward., and I wanted to use that line chart as the big piece of the package; I wanted to do some sort of callout box, but two lines with events that apply to both seemed odd to do callout boxes with so I ended up going with this highlighted year/information approach instead and tried to not make it too too text heavy.
The pie chart puts that decline into a larger perspective, showing just how many workers aren’t union-affiliated at all, and the median weekly earnings are there to give some sort of perspective beyond just membership numbers: this is a system that improves pay for workers this flatly laid out, and this system has been declining for years.
I do wish I was more creative with this, but I didn’t want to force any hackneyed graphics of like, workers’ fists or strikes or anything so I figured it was best to just stick to the numbers.