
Disney, Pixar and DreamWorks have long been considered the three most prestigious animated film manufacturing companies. Disney and Pixar, in particular, have been with me throughout my childhood with their works. To this day, the Incredibles series is still my favorite movie of all time. So I wanted to make a table to investigate the financial investment and box office receipts of Pixar films.
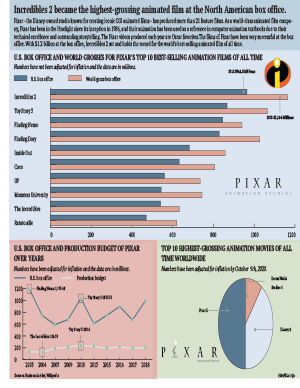
First, I’ve used a bar chart to show the U.S. box office and world totals of Pixar’s top ten highest grossing films. As it turns out, Incredibles 2 takes the number one spot with a staggering box office. It took Pixar 14 years to make this movie, and it’s hard to be a hit when you can say that Incredibles 2 contains some of Pixar’s best technology and most heart and soul. My data here does not take inflation into account, as the US rate of inflation is different from the world’s overall rate of inflation. To avoid unnecessary data errors, I’ve chosen to show it in actual box office.
I then used a bar chart to show, in chronological order, Pixar’s financial investment and US box office. Since Pixar doesn’t release new movies every year, there are some years missing from the chart. Here my figures take inflation into account, as all values are inflated in the US based on year. I’ve marked a few values that I think are important, and surprisingly, with inflation taken into account, Finding Nemo became the clear box office winner by a landslide over Toy Story and Incredibles. On the other hand, Pixar hasn’t had a lot of float in terms of financial investment, and has been in the $1.3 million to $2 million range.
The third chart I’ve chosen to show circular statistics showing the studio distribution of the ten highest-grossing films to date at the global box office. I was curious to see what people in different countries thought of the three studios. Here my figures are from Wikipedia and they have been calculated for inflation. As I thought, Pixar has half of the top ten films, Disney has four films, and DreamWorks has one.
From a designer’s point of view, this assignment did take a lot of effort on my part. First I had to determine the color tone of the entire table. Since it’s about Pixar’s chart, I decided to use some light colors. Of course there are some contrasting colors in my chart to highlight the changes in values and create a visual effect of contrast, but the overall saturation is low because every time I think of Pixar, all I think of is joy, happiness and joy. Another thing is because I used a black font, a less saturated background color makes it easier for the reader to read and pay attention to the data on the table, greatly improving the readability of the chart.In the bar chart I inserted the logos for both Incredibles and Pixar, I didn’t use any other color for the number one ranked character, Incredibles 2, so I inserted separate logos to show its status. In the circular chart I’ve inserted the logo of Pixar’s other very famous lamp, a mischievous little lamp that many people are impressed by and which has become a branding icon for Pixar and has had a profound effect on Pixar’s brand recognition, so I felt it was important to include it in my chart.
you can have one block for multiple paragraphs