Making a Peach Pie

Peach pie diagram
Click above to see full design

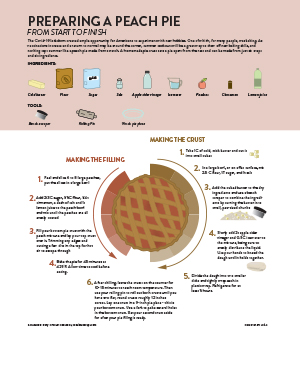
For my project, I created a process diagram explaining how to make a peach pie from scratch. Making a pie from scratch entails making a homemade crust instead of buying a premade one. I’ve heard from some people that creating a homemade pie crust is intimidating, so I wanted my diagram to show the process as simply as possible. At the top of the diagram, I have a listing of the ingredients and tools needed along with illustrations of each. I thought this was particularly important to include them because there are some unusual ingredients like apple cider vinegar in the recipe that I use, and because people unfamiliar with baking may not know what a bench scraper is. The main feature of the diagram is the necessary steps surrounding a pie illustration. In my mind, it made sense to have the instructions going in a circle to frame the pie, and it was conducive to separating the crust steps from the peach filling steps.

Color played an important role in the design of this piece. I felt like I needed to go with a lighter color scheme with pink as the core color to match the pie and baking theme. While I didn’t want the number of colors to get out of hand, I did need quite a few to properly illustrate all of the ingredients and tools, so I tried to be mindful of using colors that complimented each other nicely and fit together. I used color to separate the necessary ingredients and tools from the instructions, and to sperate the filling steps from the crust steps. Sitting behind the pie is also some color blocking to help in showing the steps and again the separation between crust and filling.

For this project, I only used two primary sources and they were the recipes that I always use when making a peach pie myself. Although my source gathering was slightly less laborious than with past projects, I did spend a lot of time trying to find appropriate visual references for all of my icons. For some of the ingredients and tools, I was able to make very simple icons based on what I had in my kitchen and based on ways I had seen things illustrated in the past. For other ingredients that needed a specific element or look to be identifiable, I used Google Images as reference. Similarly, to the process with the color, all of the ingredients or tools were very different from each other, but I tried to use unifying elements so that they could be easily identified as a group that fit together.

Overall, I am happy with how the diagram turned out. I felt less confident going into this project than I had with the others. I don’t consider making icons or lifelike illustrations to be my strong suit. I’m happy with the overall look of the piece, I don’t know that you would see it in a newspaper, but I think it could stand in another type of publication. I’m largely happy with how the icons turned out, I think there is definitely room for improvement though in some of them, and I think in a perfect world I could have been more consistent in the style used. I do like the overall layout of the piece though and how the colors and type came together.

Mass shootings in the U.S.

Thumbnail of mass shootings in the U.S.
Click the thumbnail to view the graphic

For my project I decided to map mass shootings across the U.S. Mass shootings have been an issue in the U.S. for decades, but this month there were two mass shootings just six days a part, which is why the topic was at the front of my mind. I thought the key factors to cover were where the shootings have happened, how different states compare in mass shooting frequency, gun laws across states and how shootings have increased over time.

My primary map combines a choropleth and proportional symbols map to show where mass shootings have occurred over the last 55 years and how many gun laws are enacted in each state. I thought it would be interesting to show both on one map because I think most people, myself included, would have expected mass shootings to be more prevalent in states with fewer gun laws. I also decided that accounting for population would be important to include – which led to the creation of my secondary graphic that looks at the states with the highest mass shooting rates. I was surprised by some of the states that were still in the top 50% of shooting rates, which is why I decided to add an indicator showing which political party controls the legislature and again the gun laws per state. I also wanted to include a locator map for the most recent mass shooting in Boulder, Colorado since that is what gives the package its newsworthy element. Finally, I chose to include a line chart to show how the frequency of mass shootings has increased over time.

My main source for the package was The Violence Project because they track mass shootings and have an extensive database and solid methodology. Their data base went further back than others that I saw, but I thought their reasoning for going all the way back to 1966 was logical. I also relied heavily on the Washington Post for information on the gun laws in each state. When I first decided to include gun laws, most of the sources I found were lobbying pro or against stricter gun laws, whereas the Washington Post was simply stating what exists where. I also used a handful of other sources, but only for small supporting details.

Stylistically I used my established style guide for font choices and graph layout. In this project I did rely heavily on color to convey the data, so I spent a lot of time on the color scheme. I needed to use a lot of different colors but did not want them to distract from the information. I also spent more time than usual on the internal layout of the package. I had a lot of data and several different pieces, so I did not want the layout to become too tight or hectic. This was one of the harder pieces that I have designed because there were so many different pieces to put together into one cohesive package. But in the end, I was happy with how the project turned out.

Women’s representation in government

Women's Representation Graphic
Click the graphic above for PDF

For my project, I decided to focus on women’s representation in government. Kamala Harris as the first female vice president was a huge step forward for women’s representation, but also showed how far behind the U.S. still is. I decided to focus my research on how the U.S. compares to other countries, and how the current representation compares to what it used to be. I concentrated on women in congress because it had the most data available and was easily comparable to other countries with multi-person government bodies.

My primary chart focuses on women’s representation in governments worldwide. The Inter-Parliamentary Union collects data from 190 countries and reports how many women are in the lower and upper houses. I decided to show the top 10% of countries for women’s representation because I felt it showed enough countries to paint a picture, without getting bogged down with too much data. I wanted to include a bar showing the U.S. because I think it gives a strong visual representation of how far behind other countries we are. My secondary chart shows the breakdown of men to women in the current congress. I felt it was important to show where the 27% of women come from and again, the small pie slices help emphasize how few women there are actually are in congress today. I gathered the data from the official website of congress where they have all current members listed. Finally, I wanted to include the line chart to illustrate that despite having such a small portion of congresswomen, it is the most that we have ever had. Rutgers University has a center dedicated to the history of women in congress and I felt it was important for illustrating the whole picture of where women stand in our government.

It took some digging to find reputable, data heavy sources because this topic is something that gets discussed in media often and I wanted to be sure to find the original, accurate sources. It was also important to find sources that used similar methodologies in counting representatives. For example, some sources include delegates in the count for the House of Representatives and others do not. (I chose to not include delegates because the most common count for congressmembers is 535.) Also, because of the recent U.S. election, it was important that all of the sources had the most up-to-date information possible.

Stylistically, my typeface family was Brandon Grotesque, and I chose to work in a color pallet that included grey and a dusty rose. I wanted to keep the style clean and minimal so that the data was the focus. I also tried to give a clear hierarchy to the chart showing the worldwide data and hoped to visually guide the viewer through the charts in a logical way. Overall, I am happy with how the chart package turned out. I think it has better spacing and sizing than some of my previous charts and it represents data that I care about.